How can I monitor memory usage of my Tomcat/JVM?
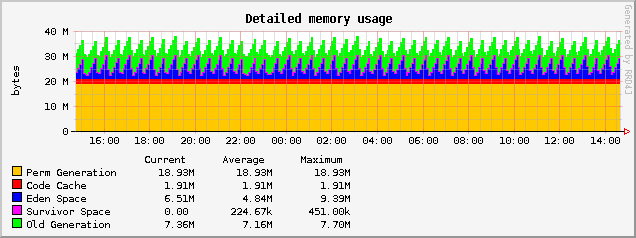
VM Host custom Java Control Panel offers graphing of basic JVM parameters. You need to enable 'monitor' attribute in your JCP and wait a 5 minutes before graphs fill with data. On `'tats' page you can select different graphing periods. See example graph below.

To closer analyze a Java process memory usage (realtime data) you can use JConsole (part of JDK). Append the below line
-Dcom.sun.management.jmxremote -Dcom.sun.management.jmxremote.port=AFREEPORTNUMBER \
-Dcom.sun.management.jmxremote.ssl=false -Dcom.sun.management.jmxremote.authenticate=false
to JAVA_OPTS in ~/appservers/apache-tomcat/bin/catalina.sh then restart Tomcat and connect with JConsole giving remote address and port:
jconsole HOSTING_SERVER_IP:JMX_PORTYou will be able to monitor live threads and loaded classes number, CPU usage and memory usage for the below memory parts:
| JVM Heap memory elements | JVM Non-Heap memory parts |
|---|---|
| Eden Space: The pool from which memory is initially allocated for most objects. | Permanent Generation: The pool containing all the reflective data of the virtual machine itself, such as class and method objects. With Java VMs that use class data sharing, this generation is divided into read-only and read-write areas. |
| Survivor Space: The pool containing objects that have survived the garbage collection of the Eden space. This space is divided to 'From Space' and 'To Space' (for example in jmap output). | Code Cache: The HotSpot Java VM also includes a code cache, containing memory that is used for compilation and storage of native code. |
| Tenured Generation/PS Old Gen: The pool containing objects that have existed for some time in the survivor space. |
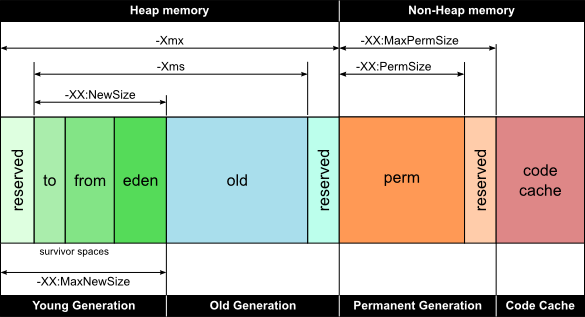
Below diagram illustrates JVM memory parts and JVM (java) related command line switches used to preset/limit some of them. 
At JVM Host you can enable JMX via JCP. You can also check what port is assigned for JMX access in the panel. For more details on JXM and JConsole see:
https://docs.oracle.com/javase/1.5.0/docs/guide/management/jconsole.html http://docs.oracle.com/javase/7/docs/technotes/guides/management/jconsole.html
Other useful tools: jvisualvm – Java Virtual Machine Monitoring, Troubleshooting, and Profiling Tool Thread Dump analyzer and its documentation IBM Thread and Monitor Dump Analyzer for Java
Before start it. We need the password file for Jconsole
cp /usr/local/jdk/jre1.8.0_112/lib/management/jmxremote.password.template /usr/local/jdk/jre1.8.0_112/lib/management/jmxremote.password
chmod 700 /usr/local/jdk/jre1.8.0_112/lib/management/jmxremote.password
vi /usr/local/jdk/jre1.8.0_112/lib/management/jmxremote.password # for comment out
monitorRole QED
controlRole R&D