How to setup Grafana + Influxdb + Telegraf

This title introduce how to configure as title description.
1. grafana_5.0.4_amd64.deb which install at Ubuntu xenial server which IP 172.22.4.101 default login account admin, password admin
2. At ubuntu server , run apt-get install influxdb
3. We plan to monitor IOMC server that need influxdb agent called Telegraf installed at host side.
Example: telegraf.conf
# Configuration for influxdb server to send metrics to
[[outputs.influxdb]]
## The full HTTP or UDP URL for your InfluxDB instance.
##
## Multiple urls can be specified as part of the same cluster,
## this means that only ONE of the urls will be written to each interval.
# urls = [“udp://127.0.0.1:8089”] # UDP endpoint example
urls = [“http://172.22.4.101:8086”] # required
## The target database for metrics (telegraf will create it if not exists).
database = "telegraf" # required
# Read metrics about cpu usage
[[inputs.cpu]]
## Whether to report per-cpu stats or not
percpu = true
## Whether to report total system cpu stats or not
totalcpu = true
## If true, collect raw CPU time metrics.
collect_cpu_time = false
## If true, compute and report the sum of all non-idle CPU states.
report_active = false
# Read metrics about disk usage by mount point
[[inputs.disk]]
## By default, telegraf gather stats for all mountpoints.
## Setting mountpoints will restrict the stats to the specified mountpoints.
# mount_points = [“/”]
## Ignore some mountpoints by filesystem type. For example (dev)tmpfs (usually
## present on /run, /var/run, /dev/shm or /dev).
ignore_fs = ["tmpfs", "devtmpfs", "devfs"]
# Read metrics about disk IO by device
[[inputs.diskio]]
# Get kernel statistics from /proc/stat
[[inputs.kernel]]
# no configuration
# Read metrics about memory usage
[[inputs.mem]]
# no configuration
# Get the number of processes and group them by status
[[inputs.processes]]
# no configuration
# Read metrics about swap memory usage
[[inputs.swap]]
# no configuration
# Read metrics about system load & uptime
[[inputs.system]]
# no configuration
# # Read metrics from the bare metal servers via IPMI
# [[inputs.ipmi_sensor]]
# ## optionally specify the path to the ipmitool executable
# # path = "/usr/bin/ipmitool"
# #
# ## optionally specify one or more servers via a url matching
# ## [username[:password]@][protocol[(address)]]
# ## e.g.
# ## root:passwd@lan(127.0.0.1)
# ##
# ## if no servers are specified, local machine sensor stats will be queried
# ##
# # servers = ["USERID:PASSW0RD@lan(192.168.1.1)"]
#
# ## Recommended: use metric 'interval' that is a multiple of 'timeout' to avoid
# ## gaps or overlap in pulled data
# interval = "30s"
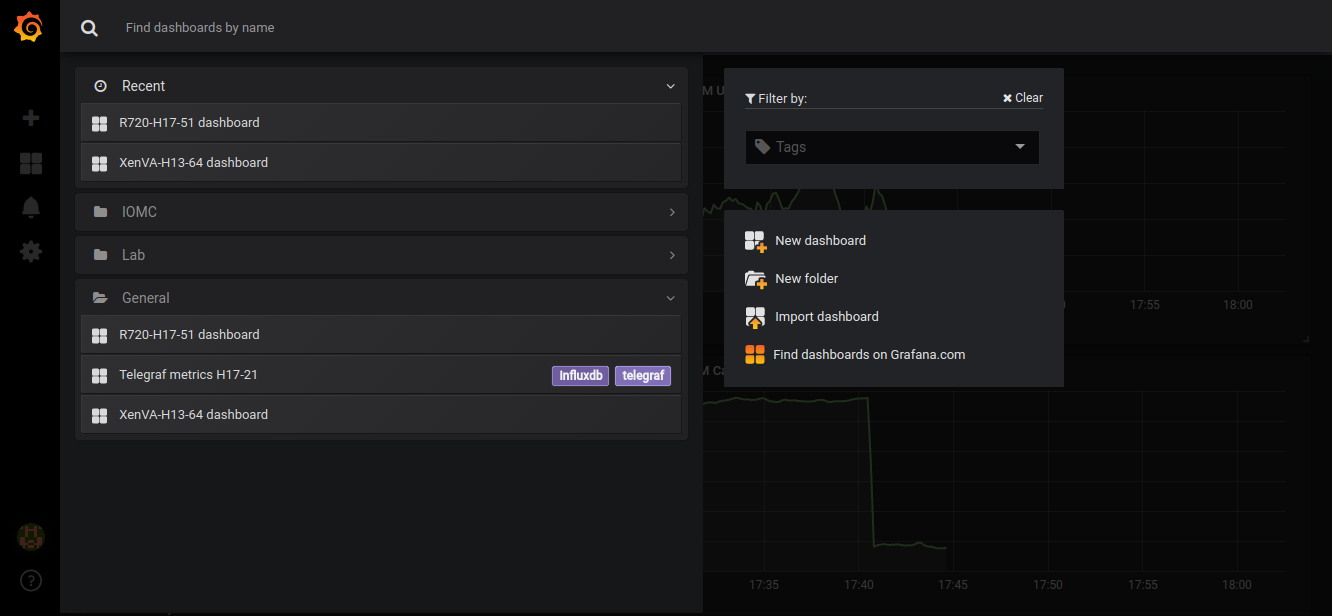
We can import Dashboard json file help we define the panel
Select the current Data source for list host name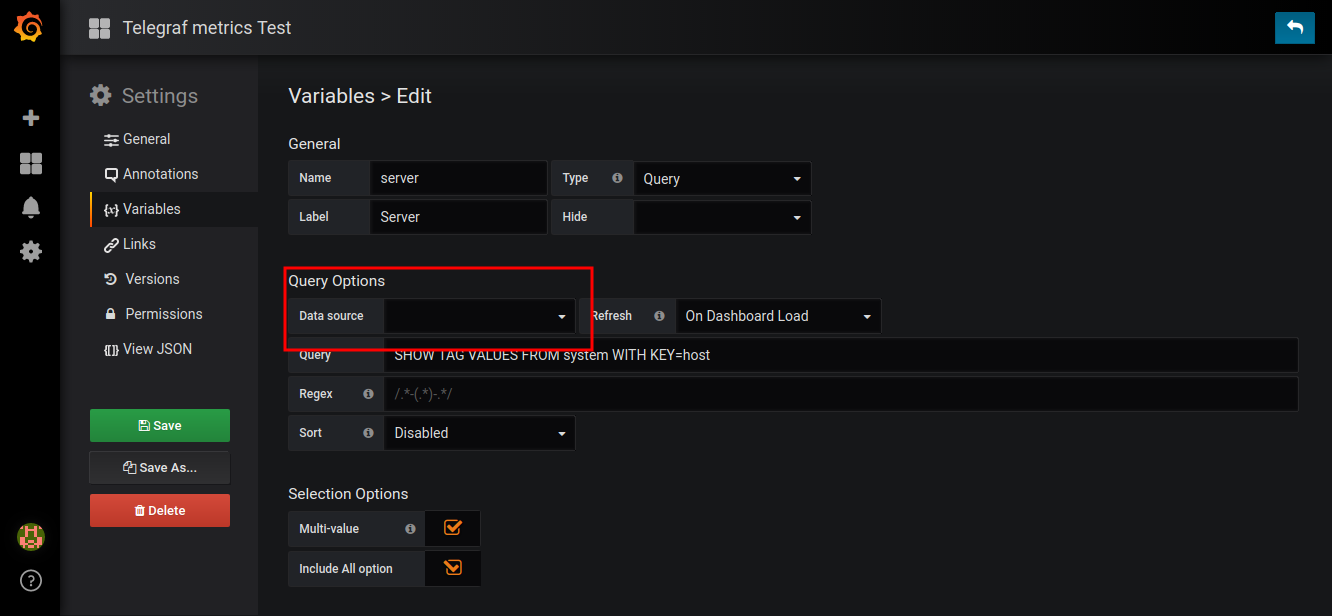
The list on Server field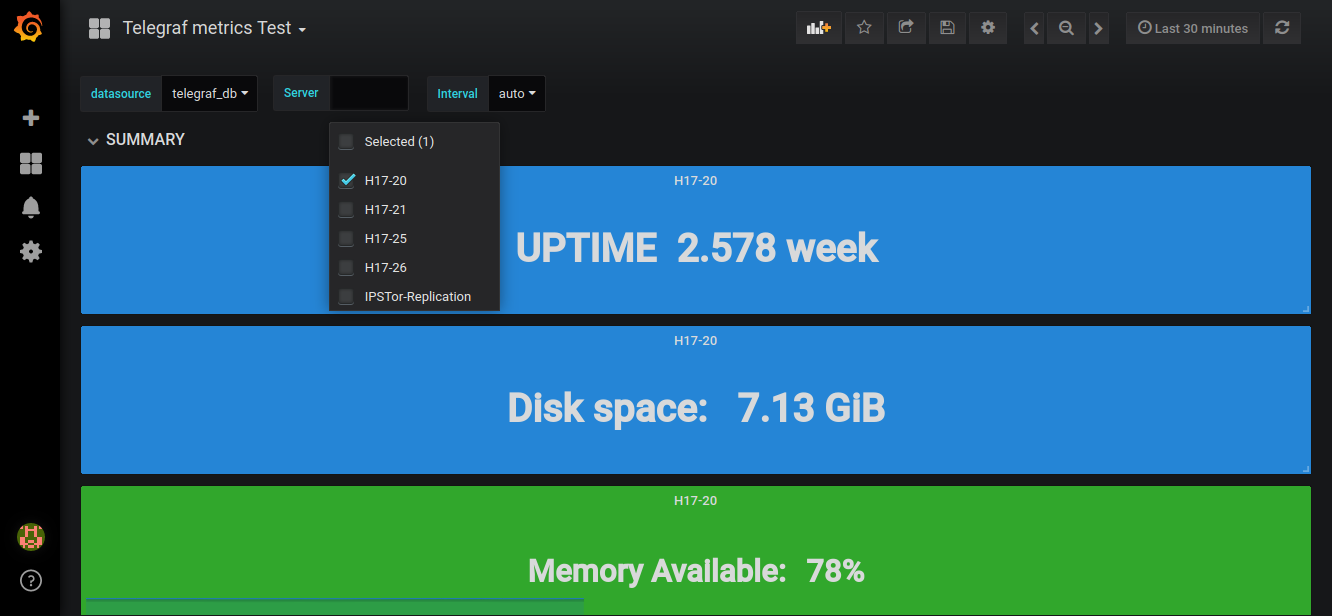
The upload dashboard JSON file
{
"id": 3,
"title": "Telegraf metrics H17-20",
"originalTitle": "Telegraf metrics H17-20",
"tags": [
"influxdb",
"telegraf"
],
"style": "dark",
"timezone": "browser",
"editable": true,
"hideControls": false,
"sharedCrosshair": true,
"rows": [
{
"collapse": false,
"editable": true,
"height": "150px",
"panels": [
{
"cacheTimeout": null,
"colorBackground": true,
"colorValue": false,
"colors": [
"rgba(40, 147, 237, 0.89)",
"rgba(40, 147, 237, 0.89)",
"rgba(40, 147, 237, 0.89)"
],
"datasource": "telegraf_db",
"editable": true,
"error": false,
"format": "s",
"gauge": {
"maxValue": 100,
"minValue": 0,
"show": false,
"thresholdLabels": false,
"thresholdMarkers": true
},
"height": "150px",
"id": 54758,
"interval": "$inter",
"links": [],
"mappingType": 1,
"mappingTypes": [
{
"name": "value to text",
"value": 1
},
{
"name": "range to text",
"value": 2
}
],
"maxDataPoints": 100,
"minSpan": 4,
"nullPointMode": "connected",
"nullText": null,
"postfix": "",
"postfixFontSize": "50%",
"prefix": "UPTIME",
"prefixFontSize": "100%",
"rangeMaps": [
{
"from": "null",
"text": "N/A",
"to": "null"
}
],
"repeat": "server",
"span": 12,
"sparkline": {
"fillColor": "rgba(31, 118, 189, 0.18)",
"full": false,
"lineColor": "rgb(31, 120, 193)",
"show": false
},
"targets": [
{
"dsType": "influxdb",
"groupBy": [
{
"interval": "auto",
"params": [
"auto"
],
"type": "time"
}
],
"measurement": "system_uptime",
"policy": "default",
"query": "SELECT last(\"uptime\") AS \"value\" FROM \"system\" WHERE \"host\" =~ /$server$/ AND $timeFilter GROUP BY time($interval)",
"rawQuery": true,
"refId": "A",
"resultFormat": "time_series",
"select": [
[
{
"params": [
"value"
],
"type": "field"
},
{
"params": [],
"type": "mean"
}
]
],
"tags": []
}
],
"thresholds": "",
"title": "$server",
"type": "singlestat",
"valueFontSize": "100%",
"valueMaps": [
{
"op": "=",
"text": "N/A",
"value": "null"
}
],
"valueName": "current"
},
{
"cacheTimeout": null,
"colorBackground": true,
"colorValue": false,
"colors": [
"rgba(40, 147, 237, 0.89)",
"rgba(40, 147, 237, 0.89)",
"rgba(40, 147, 237, 0.89)"
],
"datasource": "telegraf_db",
"editable": true,
"error": false,
"format": "bytes",
"gauge": {
"maxValue": 100,
"minValue": 0,
"show": false,
"thresholdLabels": false,
"thresholdMarkers": true
},
"height": "150px",
"id": 2092,
"interval": "$inter",
"links": [],
"mappingType": 1,
"mappingTypes": [
{
"name": "value to text",
"value": 1
},
{
"name": "range to text",
"value": 2
}
],
"maxDataPoints": 100,
"minSpan": 4,
"nullPointMode": "connected",
"nullText": null,
"postfix": "",
"postfixFontSize": "50%",
"prefix": "Disk space: ",
"prefixFontSize": "100%",
"rangeMaps": [
{
"from": "null",
"text": "N/A",
"to": "null"
}
],
"repeat": "server",
"span": 12,
"sparkline": {
"fillColor": "rgba(31, 118, 189, 0.18)",
"full": false,
"lineColor": "rgb(31, 120, 193)",
"show": false
},
"targets": [
{
"dsType": "influxdb",
"groupBy": [
{
"interval": "auto",
"params": [
"auto"
],
"type": "time"
}
],
"policy": "default",
"query": "SELECT mean(\"free\") AS \"value\" FROM \"disk\" WHERE \"host\" =~ /$server$/ AND \"path\" = '/' AND $timeFilter GROUP BY time($interval)",
"rawQuery": true,
"refId": "A",
"resultFormat": "time_series",
"select": [
[
{
"params": [
"value"
],
"type": "field"
},
{
"params": [],
"type": "mean"
}
]
],
"tags": []
}
],
"thresholds": "",
"title": "$server",
"type": "singlestat",
"valueFontSize": "100%",
"valueMaps": [
{
"op": "=",
"text": "N/A",
"value": "null"
}
],
"valueName": "current"
},
{
"cacheTimeout": null,
"colorBackground": true,
"colorValue": false,
"colors": [
"rgba(255, 0, 0, 0.67)",
"rgba(237, 129, 40, 0.89)",
"rgba(50, 172, 45, 0.97)"
],
"datasource": "telegraf_db",
"editable": true,
"error": false,
"format": "percent",
"gauge": {
"maxValue": 100,
"minValue": 0,
"show": false,
"thresholdLabels": false,
"thresholdMarkers": true
},
"id": 2165,
"interval": "$inter",
"links": [],
"mappingType": 1,
"mappingTypes": [
{
"name": "value to text",
"value": 1
},
{
"name": "range to text",
"value": 2
}
],
"maxDataPoints": 100,
"minSpan": 4,
"nullPointMode": "connected",
"nullText": null,
"postfix": "",
"postfixFontSize": "50%",
"prefix": "Memory Available:",
"prefixFontSize": "80%",
"rangeMaps": [
{
"from": "null",
"text": "N/A",
"to": "null"
}
],
"repeat": "server",
"span": 12,
"sparkline": {
"fillColor": "rgba(31, 118, 189, 0.18)",
"full": false,
"lineColor": "rgb(31, 120, 193)",
"show": true
},
"targets": [
{
"dsType": "influxdb",
"groupBy": [
{
"interval": "auto",
"params": [
"auto"
],
"type": "time"
}
],
"measurement": "system_uptime",
"policy": "default",
"query": "SELECT mean(\"available_percent\") AS \"value\" FROM \"mem\" WHERE \"host\" =~ /$server$/ AND $timeFilter GROUP BY time($interval)",
"rawQuery": true,
"refId": "A",
"resultFormat": "time_series",
"select": [
[
{
"params": [
"value"
],
"type": "field"
},
{
"params": [],
"type": "mean"
}
]
],
"tags": []
}
],
"thresholds": "80,0",
"title": "$server",
"type": "singlestat",
"valueFontSize": "80%",
"valueMaps": [
{
"op": "=",
"text": "N/A",
"value": "null"
}
],
"valueName": "current"
}
],
"showTitle": true,
"title": "SUMMARY"
},
{
"collapse": true,
"editable": true,
"height": 287,
"panels": [
{
"aliasColors": {},
"bars": false,
"datasource": "IOMC telegraf agent db",
"editable": true,
"error": false,
"fill": 1,
"grid": {
"leftLogBase": 1,
"leftMax": null,
"leftMin": null,
"rightLogBase": 1,
"rightMax": null,
"rightMin": null,
"threshold1": null,
"threshold1Color": "rgba(216, 200, 27, 0.27)",
"threshold2": null,
"threshold2Color": "rgba(234, 112, 112, 0.22)"
},
"id": 42026,
"interval": "$inter",
"legend": {
"alignAsTable": true,
"avg": true,
"current": true,
"max": true,
"min": true,
"rightSide": true,
"show": true,
"total": false,
"values": true
},
"lines": true,
"linewidth": 1,
"links": [],
"nullPointMode": "connected",
"percentage": false,
"pointradius": 5,
"points": false,
"renderer": "flot",
"seriesOverrides": [
{
"alias": "/ in$/",
"transform": "negative-Y"
}
],
"span": 12,
"stack": false,
"steppedLine": false,
"targets": [
{
"alias": "$tag_host: $tag_interface: $col",
"dsType": "influxdb",
"function": "derivative",
"groupBy": [
{
"interval": "auto",
"params": [
"auto"
],
"type": "time"
},
{
"key": "host",
"params": [
"tag"
],
"type": "tag"
},
{
"key": "interface",
"params": [
"tag"
],
"type": "tag"
}
],
"measurement": "net_bytes_recv",
"policy": "default",
"query": "SELECT non_negative_derivative(mean(bytes_recv),1s)*8 as \"in\" FROM \"net\" WHERE host =~ /$server/ AND interface =~ /(vlan|eth|bond).*/ AND $timeFilter GROUP BY time($interval), * fill(none)",
"rawQuery": true,
"refId": "A",
"resultFormat": "time_series",
"select": [
[
{
"params": [
"value"
],
"type": "field"
},
{
"params": [],
"type": "mean"
}
]
],
"tags": []
},
{
"alias": "$tag_host: $tag_interface: $col",
"dsType": "influxdb",
"function": "derivative",
"groupBy": [
{
"interval": "auto",
"params": [
"auto"
],
"type": "time"
},
{
"key": "host",
"params": [
"tag"
],
"type": "tag"
},
{
"key": "interface",
"params": [
"tag"
],
"type": "tag"
}
],
"measurement": "net_bytes_recv",
"policy": "default",
"query": "SELECT non_negative_derivative(mean(bytes_sent),1s)*8 as \"out\" FROM \"net\" WHERE host =~ /$server/ AND interface =~ /(vlan|eth|bond).*/ AND $timeFilter GROUP BY time($interval), * fill(none)",
"rawQuery": true,
"refId": "B",
"resultFormat": "time_series",
"select": [
[
{
"params": [
"value"
],
"type": "field"
},
{
"params": [],
"type": "mean"
}
]
],
"tags": []
}
],
"timeFrom": null,
"timeShift": null,
"title": "Network Usage",
"tooltip": {
"msResolution": false,
"shared": true,
"sort": 0,
"value_type": "cumulative"
},
"type": "graph",
"x-axis": true,
"xaxis": {
"show": true
},
"y-axis": true,
"y_formats": [
"short",
"short"
],
"yaxes": [
{
"format": "bps",
"logBase": 1,
"max": null,
"min": null,
"show": true
},
{
"format": "short",
"logBase": 1,
"max": null,
"min": null,
"show": true
}
]
},
{
"aliasColors": {},
"bars": true,
"datasource": "IOMC telegraf agent db",
"editable": true,
"error": false,
"fill": 1,
"grid": {
"leftLogBase": 1,
"leftMax": null,
"leftMin": null,
"rightLogBase": 1,
"rightMax": null,
"rightMin": null,
"threshold1": null,
"threshold1Color": "rgba(216, 200, 27, 0.27)",
"threshold2": null,
"threshold2Color": "rgba(234, 112, 112, 0.22)"
},
"id": 28572,
"interval": "$inter",
"legend": {
"alignAsTable": true,
"avg": true,
"current": true,
"max": true,
"min": true,
"rightSide": true,
"show": true,
"total": false,
"values": true
},
"lines": false,
"linewidth": 1,
"links": [],
"nullPointMode": "connected",
"percentage": false,
"pointradius": 5,
"points": false,
"renderer": "flot",
"seriesOverrides": [
{
"alias": "/ in$/",
"transform": "negative-Y"
}
],
"span": 12,
"stack": false,
"steppedLine": false,
"targets": [
{
"alias": "$tag_host: $tag_interface: $col",
"dsType": "influxdb",
"function": "derivative",
"groupBy": [
{
"interval": "auto",
"params": [
"auto"
],
"type": "time"
},
{
"key": "host",
"params": [
"tag"
],
"type": "tag"
},
{
"key": "interface",
"params": [
"tag"
],
"type": "tag"
}
],
"measurement": "net_bytes_recv",
"policy": "default",
"query": "SELECT non_negative_derivative(mean(packets_recv), 1s) as \"in\" FROM \"net\" WHERE host =~ /$server/ AND interface =~ /(vlan|eth|bond).*/ AND $timeFilter GROUP BY time($interval), * fill(none)",
"rawQuery": true,
"refId": "A",
"resultFormat": "time_series",
"select": [
[
{
"params": [
"value"
],
"type": "field"
},
{
"params": [],
"type": "mean"
}
]
],
"tags": []
},
{
"alias": "$tag_host: $tag_interface: $col",
"dsType": "influxdb",
"function": "derivative",
"groupBy": [
{
"interval": "auto",
"params": [
"auto"
],
"type": "time"
},
{
"key": "host",
"params": [
"tag"
],
"type": "tag"
},
{
"key": "interface",
"params": [
"tag"
],
"type": "tag"
}
],
"measurement": "net_bytes_recv",
"policy": "default",
"query": "SELECT non_negative_derivative(mean(packets_sent), 1s) as \"out\" FROM \"net\" WHERE host =~ /$server/ AND interface =~ /(vlan|eth|bond).*/ AND $timeFilter GROUP BY time($interval), * fill(none)",
"rawQuery": true,
"refId": "B",
"resultFormat": "time_series",
"select": [
[
{
"params": [
"value"
],
"type": "field"
},
{
"params": [],
"type": "mean"
}
]
],
"tags": []
}
],
"timeFrom": null,
"timeShift": null,
"title": "Network Packets",
"tooltip": {
"msResolution": false,
"shared": true,
"sort": 0,
"value_type": "cumulative"
},
"type": "graph",
"x-axis": true,
"xaxis": {
"show": true
},
"y-axis": true,
"y_formats": [
"short",
"short"
],
"yaxes": [
{
"format": "pps",
"label": "",
"logBase": 1,
"max": null,
"min": null,
"show": true
},
{
"format": "short",
"logBase": 1,
"max": null,
"min": null,
"show": true
}
]
},
{
"aliasColors": {},
"bars": true,
"editable": true,
"error": false,
"fill": 1,
"grid": {
"leftLogBase": 1,
"leftMax": null,
"leftMin": null,
"rightLogBase": 1,
"rightMax": null,
"rightMin": null,
"threshold1": null,
"threshold1Color": "rgba(216, 200, 27, 0.27)",
"threshold2": null,
"threshold2Color": "rgba(234, 112, 112, 0.22)"
},
"id": 58901,
"interval": "$inter",
"legend": {
"alignAsTable": true,
"avg": true,
"current": true,
"max": true,
"min": true,
"rightSide": true,
"show": true,
"total": false,
"values": true
},
"lines": false,
"linewidth": 1,
"links": [],
"nullPointMode": "connected",
"percentage": false,
"pointradius": 5,
"points": false,
"renderer": "flot",
"seriesOverrides": [],
"span": 6,
"stack": false,
"steppedLine": false,
"targets": [
{
"alias": "$tag_host: $tag_interface: $col",
"dsType": "influxdb",
"function": "derivative",
"groupBy": [
{
"interval": "auto",
"params": [
"auto"
],
"type": "time"
},
{
"key": "host",
"params": [
"tag"
],
"type": "tag"
},
{
"key": "interface",
"params": [
"tag"
],
"type": "tag"
}
],
"measurement": "net_bytes_recv",
"policy": "default",
"query": "SELECT non_negative_derivative(mean(drop_in), 1s) as \"in\" FROM \"net\" WHERE host =~ /$server/ AND interface =~ /(vlan|eth|bond).*/ AND $timeFilter GROUP BY time($interval), host,interface fill(none)",
"rawQuery": true,
"refId": "A",
"resultFormat": "time_series",
"select": [
[
{
"params": [
"value"
],
"type": "field"
},
{
"params": [],
"type": "mean"
}
]
],
"tags": []
},
{
"alias": "$tag_host: $tag_interface: $col",
"dsType": "influxdb",
"function": "derivative",
"groupBy": [
{
"interval": "auto",
"params": [
"auto"
],
"type": "time"
},
{
"key": "host",
"params": [
"tag"
],
"type": "tag"
},
{
"key": "interface",
"params": [
"tag"
],
"type": "tag"
}
],
"measurement": "net_bytes_recv",
"policy": "default",
"query": "SELECT non_negative_derivative(mean(drop_out), 1s) as \"out\" FROM \"net\" WHERE host =~ /$server/ AND interface =~ /(vlan|eth|bond).*/ AND $timeFilter GROUP BY time($interval), host,interface fill(none)",
"rawQuery": true,
"refId": "B",
"resultFormat": "time_series",
"select": [
[
{
"params": [
"value"
],
"type": "field"
},
{
"params": [],
"type": "mean"
}
]
],
"tags": []
}
],
"timeFrom": null,
"timeShift": null,
"title": "Packets Drop",
"tooltip": {
"msResolution": false,
"shared": true,
"sort": 0,
"value_type": "individual"
},
"type": "graph",
"x-axis": true,
"xaxis": {
"show": true
},
"y-axis": true,
"y_formats": [
"short",
"short"
],
"yaxes": [
{
"format": "short",
"label": "Packets drop",
"logBase": 1,
"max": null,
"min": 0,
"show": true
},
{
"format": "short",
"logBase": 1,
"max": null,
"min": null,
"show": true
}
]
},
{
"aliasColors": {},
"bars": true,
"editable": true,
"error": false,
"fill": 1,
"grid": {
"leftLogBase": 1,
"leftMax": null,
"leftMin": null,
"rightLogBase": 1,
"rightMax": null,
"rightMin": null,
"threshold1": null,
"threshold1Color": "rgba(216, 200, 27, 0.27)",
"threshold2": null,
"threshold2Color": "rgba(234, 112, 112, 0.22)"
},
"id": 50643,
"interval": "$inter",
"legend": {
"alignAsTable": true,
"avg": true,
"current": true,
"max": true,
"min": true,
"rightSide": true,
"show": true,
"total": false,
"values": true
},
"lines": false,
"linewidth": 2,
"links": [],
"nullPointMode": "connected",
"percentage": false,
"pointradius": 5,
"points": false,
"renderer": "flot",
"seriesOverrides": [],
"span": 6,
"stack": false,
"steppedLine": false,
"targets": [
{
"alias": "$tag_host: $tag_interface: $col",
"dsType": "influxdb",
"function": "derivative",
"groupBy": [
{
"interval": "auto",
"params": [
"auto"
],
"type": "time"
},
{
"key": "host",
"params": [
"tag"
],
"type": "tag"
},
{
"key": "interface",
"params": [
"tag"
],
"type": "tag"
}
],
"measurement": "net_bytes_recv",
"policy": "default",
"query": "SELECT non_negative_derivative(mean(err_in), 1s) as \"in\" FROM \"net\" WHERE host =~ /$server/ AND interface =~ /(vlan|eth|bond).*/ AND $timeFilter GROUP BY time($interval), host,interface fill(none)",
"rawQuery": true,
"refId": "A",
"resultFormat": "time_series",
"select": [
[
{
"params": [
"value"
],
"type": "field"
},
{
"params": [],
"type": "mean"
}
]
],
"tags": []
},
{
"alias": "$tag_host: $tag_interface: $col",
"dsType": "influxdb",
"function": "derivative",
"groupBy": [
{
"interval": "auto",
"params": [
"auto"
],
"type": "time"
},
{
"key": "host",
"params": [
"tag"
],
"type": "tag"
},
{
"key": "interface",
"params": [
"tag"
],
"type": "tag"
}
],
"measurement": "net_bytes_recv",
"policy": "default",
"query": "SELECT non_negative_derivative(mean(err_out), 1s) as \"out\" FROM \"net\" WHERE host =~ /$server/ AND interface =~ /(vlan|eth|bond).*/ AND $timeFilter GROUP BY time($interval), host,interface fill(none)",
"rawQuery": true,
"refId": "B",
"resultFormat": "time_series",
"select": [
[
{
"params": [
"value"
],
"type": "field"
},
{
"params": [],
"type": "mean"
}
]
],
"tags": []
}
],
"timeFrom": null,
"timeShift": null,
"title": "Packets Error",
"tooltip": {
"msResolution": false,
"shared": true,
"sort": 0,
"value_type": "cumulative"
},
"type": "graph",
"x-axis": true,
"xaxis": {
"show": true
},
"y-axis": true,
"y_formats": [
"short",
"short"
],
"yaxes": [
{
"format": "short",
"label": "Packets drop",
"logBase": 1,
"max": null,
"min": 0,
"show": true
},
{
"format": "short",
"logBase": 1,
"max": null,
"min": null,
"show": true
}
]
}
],
"showTitle": true,
"title": "Network"
},
{
"collapse": false,
"editable": true,
"height": 312,
"panels": [
{
"aliasColors": {},
"bars": false,
"datasource": "telegraf_db",
"editable": true,
"error": false,
"fill": 0,
"grid": {
"leftLogBase": 1,
"leftMax": null,
"leftMin": null,
"rightLogBase": 1,
"rightMax": null,
"rightMin": null,
"threshold1": null,
"threshold1Color": "rgba(216, 200, 27, 0.27)",
"threshold2": null,
"threshold2Color": "rgba(234, 112, 112, 0.22)"
},
"id": 54694,
"interval": "$inter",
"legend": {
"alignAsTable": true,
"avg": true,
"current": true,
"max": true,
"min": true,
"show": true,
"total": false,
"values": true
},
"lines": true,
"linewidth": 1,
"links": [],
"nullPointMode": "connected",
"percentage": false,
"pointradius": 5,
"points": false,
"renderer": "flot",
"seriesOverrides": [],
"span": 6,
"stack": false,
"steppedLine": false,
"targets": [
{
"alias": "$tag_host: $col",
"dsType": "influxdb",
"function": "mean",
"groupBy": [
{
"interval": "auto",
"params": [
"auto"
],
"type": "time"
},
{
"key": "host",
"params": [
"tag"
],
"type": "tag"
}
],
"measurement": "system_load1",
"policy": "default",
"query": "SELECT mean(load1) as load1,mean(load5) as load5,mean(load15) as load15 FROM \"system\" WHERE host =~ /$server/ AND $timeFilter GROUP BY time($interval), * ORDER BY asc",
"rawQuery": true,
"refId": "A",
"resultFormat": "time_series",
"select": [
[
{
"params": [
"value"
],
"type": "field"
},
{
"params": [],
"type": "mean"
}
]
],
"tags": []
}
],
"timeFrom": null,
"timeShift": null,
"title": "Load",
"tooltip": {
"shared": true,
"value_type": "cumulative"
},
"type": "graph",
"x-axis": true,
"xaxis": {
"show": true
},
"y-axis": true,
"y_formats": [
"short",
"short"
],
"yaxes": [
{
"format": "short",
"logBase": 1,
"max": null,
"min": 0,
"show": true
},
{
"format": "short",
"logBase": 1,
"max": null,
"min": null,
"show": true
}
]
},
{
"aliasColors": {},
"bars": false,
"datasource": "telegraf_db",
"editable": true,
"error": false,
"fill": 1,
"grid": {
"leftLogBase": 1,
"leftMax": null,
"leftMin": null,
"rightLogBase": 1,
"rightMax": null,
"rightMin": null,
"threshold1": null,
"threshold1Color": "rgba(216, 200, 27, 0.27)",
"threshold2": null,
"threshold2Color": "rgba(234, 112, 112, 0.22)",
"thresholdLine": false
},
"id": 12054,
"interval": "$inter",
"legend": {
"alignAsTable": true,
"avg": true,
"current": true,
"max": true,
"min": true,
"show": true,
"sort": "current",
"sortDesc": true,
"total": false,
"values": true
},
"lines": true,
"linewidth": 1,
"links": [],
"nullPointMode": "connected",
"percentage": false,
"pointradius": 5,
"points": false,
"renderer": "flot",
"seriesOverrides": [
{
"alias": "/mem_total/",
"color": "#BF1B00",
"fill": 0,
"linewidth": 2
}
],
"span": 6,
"stack": false,
"steppedLine": false,
"targets": [
{
"alias": "$tag_host: $col",
"dsType": "influxdb",
"function": "mean",
"groupBy": [
{
"interval": "auto",
"params": [
"auto"
],
"type": "time"
},
{
"key": "host",
"params": [
"tag"
],
"type": "tag"
}
],
"measurement": "mem_inactive",
"policy": "default",
"query": "SELECT mean(total) as total, mean(used) as used, mean(cached) as cached, mean(free) as free, mean(buffered) as buffered FROM \"mem\" WHERE host =~ /$server$/ AND $timeFilter GROUP BY time($interval), host ORDER BY asc",
"rawQuery": true,
"refId": "A",
"resultFormat": "time_series",
"select": [
[
{
"params": [
"value"
],
"type": "field"
},
{
"params": [],
"type": "mean"
}
]
],
"tags": []
}
],
"timeFrom": null,
"timeShift": null,
"title": "Memory usage",
"tooltip": {
"shared": true,
"value_type": "cumulative"
},
"type": "graph",
"x-axis": true,
"xaxis": {
"show": true
},
"y-axis": true,
"y_formats": [
"bytes",
"short"
],
"yaxes": [
{
"format": "bytes",
"logBase": 1,
"max": null,
"min": 0,
"show": true
},
{
"format": "short",
"logBase": 1,
"max": null,
"min": null,
"show": true
}
]
},
{
"aliasColors": {},
"bars": false,
"datasource": "telegraf_db",
"editable": true,
"error": false,
"fill": 1,
"grid": {
"leftLogBase": 1,
"leftMax": null,
"leftMin": null,
"rightLogBase": 1,
"rightMax": null,
"rightMin": null,
"threshold1": null,
"threshold1Color": "rgba(216, 200, 27, 0.27)",
"threshold2": null,
"threshold2Color": "rgba(234, 112, 112, 0.22)"
},
"id": 28239,
"interval": "$inter",
"legend": {
"alignAsTable": true,
"avg": true,
"current": true,
"hideZero": true,
"max": true,
"min": true,
"rightSide": true,
"show": true,
"sort": "current",
"sortDesc": true,
"total": false,
"values": true
},
"lines": true,
"linewidth": 1,
"links": [],
"nullPointMode": "connected",
"percentage": false,
"pointradius": 5,
"points": false,
"renderer": "flot",
"seriesOverrides": [],
"span": 12,
"stack": false,
"steppedLine": false,
"targets": [
{
"alias": "$tag_host: $col",
"dsType": "influxdb",
"function": "mean",
"groupBy": [
{
"interval": "auto",
"params": [
"auto"
],
"type": "time"
},
{
"key": "host",
"params": [
"tag"
],
"type": "tag"
}
],
"hide": false,
"measurement": "cpu_percentageBusy",
"policy": "default",
"query": "SELECT mean(usage_idle) as \"idle\", mean(usage_user) as \"user\", mean(usage_system) as \"system\", mean(usage_softirq) as \"softirq\", mean(usage_steal) as \"steal\", mean(usage_nice) as \"nice\", mean(usage_irq) as \"irq\", mean(usage_iowait) as \"iowait\", mean(usage_guest) as \"guest\", mean(usage_guest_nice) as \"guest_nice\" FROM \"cpu\" WHERE \"host\" =~ /$server$/ and cpu = 'cpu-total' AND $timeFilter GROUP BY time($interval), *",
"rawQuery": true,
"refId": "B",
"resultFormat": "time_series",
"select": [
[
{
"params": [
"value"
],
"type": "field"
},
{
"params": [],
"type": "mean"
}
]
],
"tags": []
}
],
"timeFrom": null,
"timeShift": null,
"title": "CPU",
"tooltip": {
"shared": true,
"value_type": "cumulative"
},
"type": "graph",
"x-axis": true,
"xaxis": {
"show": true
},
"y-axis": true,
"y_formats": [
"short",
"short"
],
"yaxes": [
{
"format": "percent",
"logBase": 1,
"max": 100,
"min": 0,
"show": true
},
{
"format": "short",
"logBase": 1,
"max": null,
"min": null,
"show": true
}
]
},
{
"aliasColors": {},
"bars": false,
"datasource": "telegraf_db",
"editable": true,
"error": false,
"fill": 1,
"grid": {
"leftLogBase": 1,
"leftMax": null,
"leftMin": null,
"rightLogBase": 1,
"rightMax": null,
"rightMin": null,
"threshold1": null,
"threshold1Color": "rgba(216, 200, 27, 0.27)",
"threshold2": null,
"threshold2Color": "rgba(234, 112, 112, 0.22)"
},
"id": 52240,
"interval": "$inter",
"legend": {
"alignAsTable": true,
"avg": true,
"current": true,
"max": true,
"min": true,
"show": true,
"sort": "current",
"sortDesc": true,
"total": false,
"values": true
},
"lines": true,
"linewidth": 1,
"links": [],
"nullPointMode": "connected",
"percentage": false,
"pointradius": 5,
"points": false,
"renderer": "flot",
"seriesOverrides": [
{
"alias": "/total/",
"color": "#BF1B00",
"fill": 0,
"linewidth": 2,
"zindex": 3
}
],
"span": 6,
"stack": false,
"steppedLine": true,
"targets": [
{
"alias": "$tag_host: $tag_path : $col",
"dsType": "influxdb",
"function": "mean",
"groupBy": [
{
"interval": "auto",
"params": [
"auto"
],
"type": "time"
},
{
"key": "host",
"params": [
"tag"
],
"type": "tag"
},
{
"key": "path",
"params": [
"tag"
],
"type": "tag"
}
],
"measurement": "disk_total",
"policy": "default",
"query": "SELECT mean(total) AS \"total\", mean(used) as \"used\" FROM \"disk\" WHERE \"host\" =~ /$server$/ AND \"path\" = '/' AND $timeFilter GROUP BY time($interval), \"host\", \"path\"",
"rawQuery": true,
"refId": "B",
"resultFormat": "time_series",
"select": [
[
{
"params": [
"value"
],
"type": "field"
},
{
"params": [],
"type": "mean"
}
]
],
"tags": []
}
],
"timeFrom": null,
"timeShift": null,
"title": "Disk usage",
"tooltip": {
"shared": true,
"value_type": "cumulative"
},
"type": "graph",
"x-axis": true,
"xaxis": {
"show": true
},
"y-axis": true,
"y_formats": [
"short",
"short"
],
"yaxes": [
{
"format": "bytes",
"logBase": 1,
"max": null,
"min": 0,
"show": true
},
{
"format": "short",
"logBase": 1,
"max": null,
"min": null,
"show": true
}
]
},
{
"aliasColors": {},
"bars": true,
"datasource": "telegraf_db",
"editable": true,
"error": false,
"fill": 1,
"grid": {
"leftLogBase": 1,
"leftMax": null,
"leftMin": null,
"rightLogBase": 1,
"rightMax": null,
"rightMin": null,
"threshold1": null,
"threshold1Color": "rgba(216, 200, 27, 0.27)",
"threshold2": null,
"threshold2Color": "rgba(234, 112, 112, 0.22)"
},
"id": 33458,
"interval": "$inter",
"legend": {
"alignAsTable": true,
"avg": true,
"current": true,
"max": true,
"min": true,
"show": true,
"sort": "current",
"sortDesc": true,
"total": false,
"values": true
},
"lines": false,
"linewidth": 1,
"links": [],
"nullPointMode": "connected",
"percentage": false,
"pointradius": 5,
"points": false,
"renderer": "flot",
"seriesOverrides": [
{
"alias": "/used/",
"color": "#BF1B00",
"zindex": 3
},
{
"alias": "/free/",
"bars": false,
"fill": 0,
"lines": true,
"linewidth": 1
}
],
"span": 6,
"stack": false,
"steppedLine": true,
"targets": [
{
"alias": "$tag_host: $tag_path : $col",
"dsType": "influxdb",
"function": "mean",
"groupBy": [
{
"interval": "auto",
"params": [
"auto"
],
"type": "time"
},
{
"key": "host",
"params": [
"tag"
],
"type": "tag"
},
{
"key": "path",
"params": [
"tag"
],
"type": "tag"
}
],
"measurement": "disk_inodes_free",
"policy": "default",
"query": "SELECT mean(inodes_free) as \"free\", mean(inodes_used) as \"used\" FROM \"disk\" WHERE \"host\" =~ /$server$/ AND \"path\" = '/' AND $timeFilter GROUP BY time($interval), \"host\", \"path\"",
"rawQuery": true,
"refId": "B",
"resultFormat": "time_series",
"select": [
[
{
"params": [
"value"
],
"type": "field"
},
{
"params": [],
"type": "mean"
}
]
],
"tags": []
}
],
"timeFrom": null,
"timeShift": null,
"title": "Disk inodes",
"tooltip": {
"shared": true,
"value_type": "cumulative"
},
"type": "graph",
"x-axis": true,
"xaxis": {
"show": true
},
"y-axis": true,
"y_formats": [
"short",
"short"
],
"yaxes": [
{
"format": "short",
"logBase": 10,
"max": null,
"min": 0,
"show": true
},
{
"format": "short",
"logBase": 1,
"max": null,
"min": null,
"show": true
}
]
},
{
"aliasColors": {},
"bars": false,
"datasource": "telegraf_db",
"editable": true,
"error": false,
"fill": 1,
"grid": {
"leftLogBase": 1,
"leftMax": null,
"leftMin": null,
"rightLogBase": 1,
"rightMax": null,
"rightMin": null,
"threshold1": null,
"threshold1Color": "rgba(216, 200, 27, 0.27)",
"threshold2": null,
"threshold2Color": "rgba(234, 112, 112, 0.22)",
"thresholdLine": false
},
"id": 13782,
"interval": "$inter",
"legend": {
"alignAsTable": true,
"avg": true,
"current": true,
"hideEmpty": true,
"max": true,
"min": true,
"rightSide": false,
"show": true,
"sort": "current",
"sortDesc": true,
"total": false,
"values": true
},
"lines": true,
"linewidth": 1,
"links": [],
"nullPointMode": "connected",
"percentage": false,
"pointradius": 5,
"points": false,
"renderer": "flot",
"seriesOverrides": [
{
"alias": "/read/",
"transform": "negative-Y"
}
],
"span": 6,
"stack": false,
"steppedLine": true,
"targets": [
{
"alias": "$tag_host: $tag_name: $col",
"dsType": "influxdb",
"function": "mean",
"groupBy": [
{
"interval": "auto",
"params": [
"auto"
],
"type": "time"
},
{
"key": "host",
"params": [
"tag"
],
"type": "tag"
},
{
"key": "path",
"params": [
"tag"
],
"type": "tag"
}
],
"measurement": "io_reads",
"policy": "default",
"query": "SELECT non_negative_derivative(mean(reads),1s) as \"read\" FROM \"diskio\" WHERE \"host\" =~ /$server$/ AND \"name\" =~ /(v|s)d(a|b|c|d)$/ AND $timeFilter GROUP BY time($interval), *",
"rawQuery": true,
"refId": "B",
"resultFormat": "time_series",
"select": [
[
{
"params": [
"value"
],
"type": "field"
},
{
"params": [],
"type": "mean"
}
]
],
"tags": []
},
{
"alias": "$tag_host: $tag_name: $col",
"dsType": "influxdb",
"function": "mean",
"groupBy": [
{
"interval": "auto",
"params": [
"auto"
],
"type": "time"
},
{
"key": "host",
"params": [
"tag"
],
"type": "tag"
},
{
"key": "path",
"params": [
"tag"
],
"type": "tag"
}
],
"measurement": "io_reads",
"policy": "default",
"query": "SELECT non_negative_derivative(mean(writes),1s) as \"write\" FROM \"diskio\" WHERE \"host\" =~ /$server$/ AND \"name\" =~ /(v|s)d(a|b|c|d)$/ AND $timeFilter GROUP BY time($interval), *",
"rawQuery": true,
"refId": "C",
"resultFormat": "time_series",
"select": [
[
{
"params": [
"value"
],
"type": "field"
},
{
"params": [],
"type": "mean"
}
]
],
"tags": []
}
],
"timeFrom": null,
"timeShift": null,
"title": "Disk I/O requests",
"tooltip": {
"shared": true,
"value_type": "cumulative"
},
"type": "graph",
"x-axis": true,
"xaxis": {
"show": true
},
"y-axis": true,
"y_formats": [
"short",
"short"
],
"yaxes": [
{
"format": "short",
"logBase": 1,
"max": null,
"min": null,
"show": true
},
{
"format": "short",
"logBase": 1,
"max": null,
"min": null,
"show": true
}
]
},
{
"aliasColors": {},
"bars": false,
"datasource": "telegraf_db",
"editable": true,
"error": false,
"fill": 1,
"grid": {
"leftLogBase": 1,
"leftMax": null,
"leftMin": null,
"rightLogBase": 1,
"rightMax": null,
"rightMin": null,
"threshold1": null,
"threshold1Color": "rgba(216, 200, 27, 0.27)",
"threshold2": null,
"threshold2Color": "rgba(234, 112, 112, 0.22)",
"thresholdLine": false
},
"id": 60200,
"interval": "$inter",
"legend": {
"alignAsTable": true,
"avg": true,
"current": true,
"hideEmpty": true,
"max": true,
"min": true,
"rightSide": false,
"show": true,
"sort": "max",
"sortDesc": true,
"total": false,
"values": true
},
"lines": true,
"linewidth": 1,
"links": [],
"nullPointMode": "connected",
"percentage": false,
"pointradius": 5,
"points": false,
"renderer": "flot",
"seriesOverrides": [
{
"alias": "/read/",
"transform": "negative-Y"
}
],
"span": 6,
"stack": false,
"steppedLine": true,
"targets": [
{
"alias": "$tag_host: $tag_name: $col",
"dsType": "influxdb",
"function": "mean",
"groupBy": [
{
"interval": "auto",
"params": [
"auto"
],
"type": "time"
},
{
"key": "host",
"params": [
"tag"
],
"type": "tag"
},
{
"key": "path",
"params": [
"tag"
],
"type": "tag"
}
],
"measurement": "io_reads",
"policy": "default",
"query": "SELECT non_negative_derivative(mean(read_bytes),1s) as \"read\" FROM \"diskio\" WHERE \"host\" =~ /$server$/ AND \"name\" =~ /(v|s)d(a|b|c|d)$/ AND $timeFilter GROUP BY time($interval), *",
"rawQuery": true,
"refId": "B",
"resultFormat": "time_series",
"select": [
[
{
"params": [
"value"
],
"type": "field"
},
{
"params": [],
"type": "mean"
}
]
],
"tags": []
},
{
"alias": "$tag_host: $tag_name: $col",
"dsType": "influxdb",
"function": "mean",
"groupBy": [
{
"interval": "auto",
"params": [
"auto"
],
"type": "time"
},
{
"key": "host",
"params": [
"tag"
],
"type": "tag"
},
{
"key": "path",
"params": [
"tag"
],
"type": "tag"
}
],
"measurement": "io_reads",
"policy": "default",
"query": "SELECT non_negative_derivative(mean(write_bytes),1s) as \"write\" FROM \"diskio\" WHERE \"host\" =~ /$server$/ AND \"name\" =~ /(v|s)d(a|b|c|d)$/ AND $timeFilter GROUP BY time($interval), *",
"rawQuery": true,
"refId": "C",
"resultFormat": "time_series",
"select": [
[
{
"params": [
"value"
],
"type": "field"
},
{
"params": [],
"type": "mean"
}
]
],
"tags": []
}
],
"timeFrom": null,
"timeShift": null,
"title": "Disk I/O bytes",
"tooltip": {
"shared": true,
"value_type": "cumulative"
},
"type": "graph",
"x-axis": true,
"xaxis": {
"show": true
},
"y-axis": true,
"y_formats": [
"short",
"short"
],
"yaxes": [
{
"format": "bytes",
"logBase": 1,
"max": null,
"min": null,
"show": true
},
{
"format": "short",
"logBase": 1,
"max": null,
"min": null,
"show": true
}
]
},
{
"aliasColors": {},
"bars": false,
"datasource": "telegraf_db",
"editable": true,
"error": false,
"fill": 1,
"grid": {
"leftLogBase": 1,
"leftMax": null,
"leftMin": null,
"rightLogBase": 1,
"rightMax": null,
"rightMin": null,
"threshold1": null,
"threshold1Color": "rgba(216, 200, 27, 0.27)",
"threshold2": null,
"threshold2Color": "rgba(234, 112, 112, 0.22)",
"thresholdLine": false
},
"id": 56720,
"interval": "$inter",
"legend": {
"alignAsTable": true,
"avg": true,
"current": true,
"hideEmpty": true,
"max": true,
"min": true,
"rightSide": false,
"show": true,
"sort": "current",
"sortDesc": true,
"total": false,
"values": true
},
"lines": true,
"linewidth": 1,
"links": [],
"nullPointMode": "connected",
"percentage": false,
"pointradius": 5,
"points": false,
"renderer": "flot",
"seriesOverrides": [
{
"alias": "/read/",
"transform": "negative-Y"
}
],
"span": 6,
"stack": false,
"steppedLine": true,
"targets": [
{
"alias": "$tag_host: $tag_name: $col",
"dsType": "influxdb",
"function": "mean",
"groupBy": [
{
"interval": "auto",
"params": [
"auto"
],
"type": "time"
},
{
"key": "host",
"params": [
"tag"
],
"type": "tag"
},
{
"key": "path",
"params": [
"tag"
],
"type": "tag"
}
],
"measurement": "io_reads",
"policy": "default",
"query": "SELECT non_negative_derivative(mean(read_time),1s) as \"read\" FROM \"diskio\" WHERE \"host\" =~ /$server$/ AND \"name\" =~ /(v|s)d(a|b|c|d)$/ AND $timeFilter GROUP BY time($interval), *",
"rawQuery": true,
"refId": "B",
"resultFormat": "time_series",
"select": [
[
{
"params": [
"value"
],
"type": "field"
},
{
"params": [],
"type": "mean"
}
]
],
"tags": []
},
{
"alias": "$tag_host: $tag_name: $col",
"dsType": "influxdb",
"function": "mean",
"groupBy": [
{
"interval": "auto",
"params": [
"auto"
],
"type": "time"
},
{
"key": "host",
"params": [
"tag"
],
"type": "tag"
},
{
"key": "path",
"params": [
"tag"
],
"type": "tag"
}
],
"measurement": "io_reads",
"policy": "default",
"query": "SELECT non_negative_derivative(mean(write_time),1s) as \"write\" FROM \"diskio\" WHERE \"host\" =~ /$server$/ AND \"name\" =~ /(v|s)d(a|b|c|d)$/ AND $timeFilter GROUP BY time($interval), *",
"rawQuery": true,
"refId": "A",
"resultFormat": "time_series",
"select": [
[
{
"params": [
"value"
],
"type": "field"
},
{
"params": [],
"type": "mean"
}
]
],
"tags": []
}
],
"timeFrom": null,
"timeShift": null,
"title": "Disk I/O time",
"tooltip": {
"shared": true,
"value_type": "cumulative"
},
"type": "graph",
"x-axis": true,
"xaxis": {
"show": true
},
"y-axis": true,
"y_formats": [
"short",
"short"
],
"yaxes": [
{
"format": "ms",
"logBase": 1,
"max": null,
"min": null,
"show": true
},
{
"format": "short",
"logBase": 1,
"max": null,
"min": null,
"show": true
}
]
},
{
"aliasColors": {},
"bars": false,
"datasource": "telegraf_db",
"editable": true,
"error": false,
"fill": 1,
"grid": {
"leftLogBase": 1,
"leftMax": null,
"leftMin": null,
"rightLogBase": 1,
"rightMax": null,
"rightMin": null,
"threshold1": null,
"threshold1Color": "rgba(216, 200, 27, 0.27)",
"threshold2": null,
"threshold2Color": "rgba(234, 112, 112, 0.22)",
"thresholdLine": false
},
"id": 61850,
"interval": "$inter",
"legend": {
"alignAsTable": true,
"avg": true,
"current": true,
"max": true,
"min": true,
"show": true,
"sort": "current",
"sortDesc": true,
"total": false,
"values": true
},
"lines": true,
"linewidth": 1,
"links": [],
"nullPointMode": "connected",
"percentage": false,
"pointradius": 5,
"points": false,
"renderer": "flot",
"seriesOverrides": [
{
"alias": "/total/",
"fill": 0
}
],
"span": 6,
"stack": false,
"steppedLine": true,
"targets": [
{
"alias": "$tag_host: $col",
"dsType": "influxdb",
"function": "mean",
"groupBy": [
{
"interval": "auto",
"params": [
"auto"
],
"type": "time"
},
{
"key": "host",
"params": [
"tag"
],
"type": "tag"
}
],
"measurement": "swap_in",
"policy": "default",
"query": "SELECT mean(free) as \"free\", mean(used) as \"used\", mean(total) as \"total\" FROM \"swap\" WHERE host =~ /$server$/ AND $timeFilter GROUP BY time($interval), host ORDER BY asc",
"rawQuery": true,
"refId": "B",
"resultFormat": "time_series",
"select": [
[
{
"params": [
"value"
],
"type": "field"
},
{
"params": [],
"type": "mean"
}
]
],
"tags": []
}
],
"timeFrom": null,
"timeShift": null,
"title": "Swap usage (bytes)",
"tooltip": {
"shared": true,
"value_type": "cumulative"
},
"type": "graph",
"x-axis": true,
"xaxis": {
"show": true
},
"y-axis": true,
"y_formats": [
"bytes",
"short"
],
"yaxes": [
{
"format": "bytes",
"logBase": 1,
"max": null,
"min": 0,
"show": true
},
{
"format": "short",
"logBase": 1,
"max": null,
"min": null,
"show": true
}
]
},
{
"aliasColors": {},
"bars": false,
"datasource": "telegraf_db",
"editable": true,
"error": false,
"fill": 1,
"grid": {
"leftLogBase": 1,
"leftMax": null,
"leftMin": null,
"rightLogBase": 1,
"rightMax": null,
"rightMin": null,
"threshold1": null,
"threshold1Color": "rgba(216, 200, 27, 0.27)",
"threshold2": null,
"threshold2Color": "rgba(234, 112, 112, 0.22)",
"thresholdLine": false
},
"id": 26024,
"interval": "$inter",
"legend": {
"alignAsTable": true,
"avg": true,
"current": true,
"max": true,
"min": true,
"show": true,
"sort": "current",
"sortDesc": true,
"total": false,
"values": true
},
"lines": true,
"linewidth": 1,
"links": [],
"nullPointMode": "connected",
"percentage": false,
"pointradius": 5,
"points": false,
"renderer": "flot",
"seriesOverrides": [
{
"alias": "/in/",
"transform": "negative-Y"
}
],
"span": 6,
"stack": false,
"steppedLine": false,
"targets": [
{
"alias": "$tag_host: $col",
"dsType": "influxdb",
"function": "mean",
"groupBy": [
{
"interval": "auto",
"params": [
"auto"
],
"type": "time"
},
{
"key": "host",
"params": [
"tag"
],
"type": "tag"
}
],
"measurement": "swap_in",
"policy": "default",
"query": "SELECT mean(\"in\") as \"in\", mean(\"out\") as \"out\" FROM \"swap\" WHERE host =~ /$server$/ AND $timeFilter GROUP BY time($interval), host ORDER BY asc",
"rawQuery": true,
"refId": "A",
"resultFormat": "time_series",
"select": [
[
{
"params": [
"value"
],
"type": "field"
},
{
"params": [],
"type": "mean"
}
]
],
"tags": []
}
],
"timeFrom": null,
"timeShift": null,
"title": "Swap I/O bytes",
"tooltip": {
"shared": true,
"value_type": "cumulative"
},
"type": "graph",
"x-axis": true,
"xaxis": {
"show": true
},
"y-axis": true,
"y_formats": [
"short",
"short"
],
"yaxes": [
{
"format": "bytes",
"logBase": 1,
"max": null,
"min": null,
"show": true
},
{
"format": "short",
"logBase": 1,
"max": null,
"min": null,
"show": true
}
]
},
{
"aliasColors": {},
"bars": false,
"datasource": "telegraf_db",
"editable": true,
"error": false,
"fill": 1,
"grid": {
"leftLogBase": 1,
"leftMax": null,
"leftMin": null,
"rightLogBase": 1,
"rightMax": null,
"rightMin": null,
"threshold1": null,
"threshold1Color": "rgba(216, 200, 27, 0.27)",
"threshold2": null,
"threshold2Color": "rgba(234, 112, 112, 0.22)",
"thresholdLine": false
},
"id": 16118,
"interval": "$inter",
"legend": {
"alignAsTable": true,
"avg": true,
"current": true,
"max": true,
"min": true,
"show": true,
"sort": "current",
"sortDesc": true,
"total": false,
"values": true
},
"lines": true,
"linewidth": 1,
"links": [],
"nullPointMode": "connected",
"percentage": false,
"pointradius": 5,
"points": false,
"renderer": "flot",
"seriesOverrides": [],
"span": 6,
"stack": false,
"steppedLine": false,
"targets": [
{
"alias": "$tag_host: $col",
"dsType": "influxdb",
"function": "mean",
"groupBy": [
{
"interval": "auto",
"params": [
"auto"
],
"type": "time"
},
{
"key": "host",
"params": [
"tag"
],
"type": "tag"
}
],
"measurement": "swap_in",
"policy": "default",
"query": "SELECT mean(used_percent) as used FROM \"swap\" WHERE host =~ /$server$/ AND $timeFilter GROUP BY time($interval), host ORDER BY asc",
"rawQuery": true,
"refId": "A",
"resultFormat": "time_series",
"select": [
[
{
"params": [
"value"
],
"type": "field"
},
{
"params": [],
"type": "mean"
}
]
],
"tags": []
}
],
"timeFrom": null,
"timeShift": null,
"title": "Swap usage (percent)",
"tooltip": {
"shared": true,
"value_type": "cumulative"
},
"type": "graph",
"x-axis": true,
"xaxis": {
"show": true
},
"y-axis": true,
"y_formats": [
"bytes",
"short"
],
"yaxes": [
{
"format": "percent",
"logBase": 1,
"max": 100,
"min": 0,
"show": true
},
{
"format": "short",
"logBase": 1,
"max": null,
"min": null,
"show": true
}
]
}
],
"showTitle": true,
"title": "SYSTEM"
}
],
"time": {
"from": "now-30m",
"to": "now"
},
"timepicker": {
"refresh_intervals": [
"5s",
"10s",
"30s",
"1m",
"5m",
"15m",
"30m",
"1h",
"2h",
"1d"
],
"time_options": [
"5m",
"15m",
"1h",
"6h",
"12h",
"24h",
"2d",
"7d",
"30d"
]
},
"templating": {
"enable": true,
"list": [
{
"allFormat": "glob",
"current": {
"text": "influxdb",
"value": "influxdb"
},
"hide": 0,
"includeAll": false,
"multi": false,
"name": "datasource",
"options": [
{
"text": "influxdb",
"value": "influxdb",
"selected": true
}
],
"query": "influxdb",
"refresh": 1,
"regex": "",
"type": "datasource"
},
{
"allFormat": "glob",
"current": {
"text": "H17-20",
"value": "H17-20"
},
"hide": 0,
"includeAll": false,
"label": "Server",
"multi": true,
"name": "server",
"options": [],
"query": "SHOW TAG VALUES FROM system WITH KEY=host",
"refresh": 1,
"type": "query"
},
{
"allFormat": "glob",
"auto": true,
"auto_count": 100,
"auto_min": "30s",
"current": {
"text": "auto",
"value": "$__auto_interval"
},
"datasource": null,
"hide": 0,
"includeAll": false,
"label": "Interval",
"multi": false,
"name": "inter",
"options": [
{
"selected": true,
"text": "auto",
"value": "$__auto_interval"
},
{
"selected": false,
"text": "30s",
"value": "30s"
},
{
"selected": false,
"text": "1m",
"value": "1m"
},
{
"selected": false,
"text": "2m",
"value": "2m"
},
{
"selected": false,
"text": "5m",
"value": "5m"
},
{
"selected": false,
"text": "10m",
"value": "10m"
},
{
"selected": false,
"text": "30m",
"value": "30m"
},
{
"selected": false,
"text": "1h",
"value": "1h"
}
],
"query": "30s,1m,2m,5m,10m,30m,1h",
"refresh": 0,
"type": "interval"
}
]
},
"annotations": {
"list": []
},
"schemaVersion": 8,
"version": 7,
"links": []
}