netdata backend database support - InfluxDB + Grafana UI

How to install netdata
bash <(curl -Ss https://my-netdata.io/kickstart-static64.sh)
Edit netdata.conf at /opt/netdata/etc/netdata
[global]
# glibc malloc arena max for plugins = 1
hostname = R720-H17-51
history = 3996
update every = 1
config directory = /opt/netdata/etc/netdata
log directory = /opt/netdata/var/log/netdata
web files directory = /opt/netdata/usr/share/netdata/web
cache directory = /opt/netdata/var/cache/netdata
lib directory = /opt/netdata/var/lib/netdata
home directory = /opt/netdata/var/cache/netdata
plugins directory = "/opt/netdata/usr/libexec/netdata/plugins.d" "/opt/netdata/etc/netdata/custom-plugins.d"
memory mode = save
memory deduplication (ksm) = yes
TZ environment variable = :/etc/localtime
timezone = Asia/Taipei
debug flags = 0x0000000000000000
debug log = /opt/netdata/var/log/netdata/debug.log
error log = /opt/netdata/var/log/netdata/error.log
access log = /opt/netdata/var/log/netdata/access.log
[backend]
host tags = list
enabled = yes
data source = average
type = opentsdb
destination = tcp:172.22.4.101:4242
prefix = netdata
hostname = R720-H17-51
update every = 10
buffer on failures = 10
timeout ms = 20000
Save netdata.conf and restart netdata service
$systemctl restart netdata
The backend server is a Ubuntu Server
$sudo apt-get install influxdb
$sudo apt-get install grafana
$vi /etc/influxdb/influxdb.conf
[meta]
# Controls if this node should run the metaservice and participate in the Raft group
enabled = true
# Where the metadata/raft database is stored
dir = "/var/lib/influxdb/meta"
bind-address = ":8088"
retention-autocreate = true
election-timeout = "1s"
heartbeat-timeout = "1s"
leader-lease-timeout = "500ms"
commit-timeout = "50ms"
cluster-tracing = false
[data]
# Controls if this node holds time series data shards in the cluster
enabled = true
dir = "/var/lib/influxdb/data"
# The following WAL settings are for the b1 storage engine used in 0.9.2. They won't
# apply to any new shards created after upgrading to a version > 0.9.3.
max-wal-size = 104857600 # Maximum size the WAL can reach before a flush. Defaults to 100MB.
wal-flush-interval = "10m" # Maximum time data can sit in WAL before a flush.
wal-partition-flush-delay = "2s" # The delay time between each WAL partition being flushed.
# These are the WAL settings for the storage engine >= 0.9.3
wal-dir = "/var/lib/influxdb/wal"
wal-logging-enabled = true
data-logging-enabled = true
[opentsdb]
enabled = true
bind-address = "172.22.4.101:4242"
database = "opentsdb"
# retention-policy = ""
consistency-level = "one"
tls-enabled = false
# certificate= ""
log-point-errors = true # Log an error for every malformed point.
Save influxdb.conf and restart influxdb service
$sudo /etc/init.d/influxdb restart
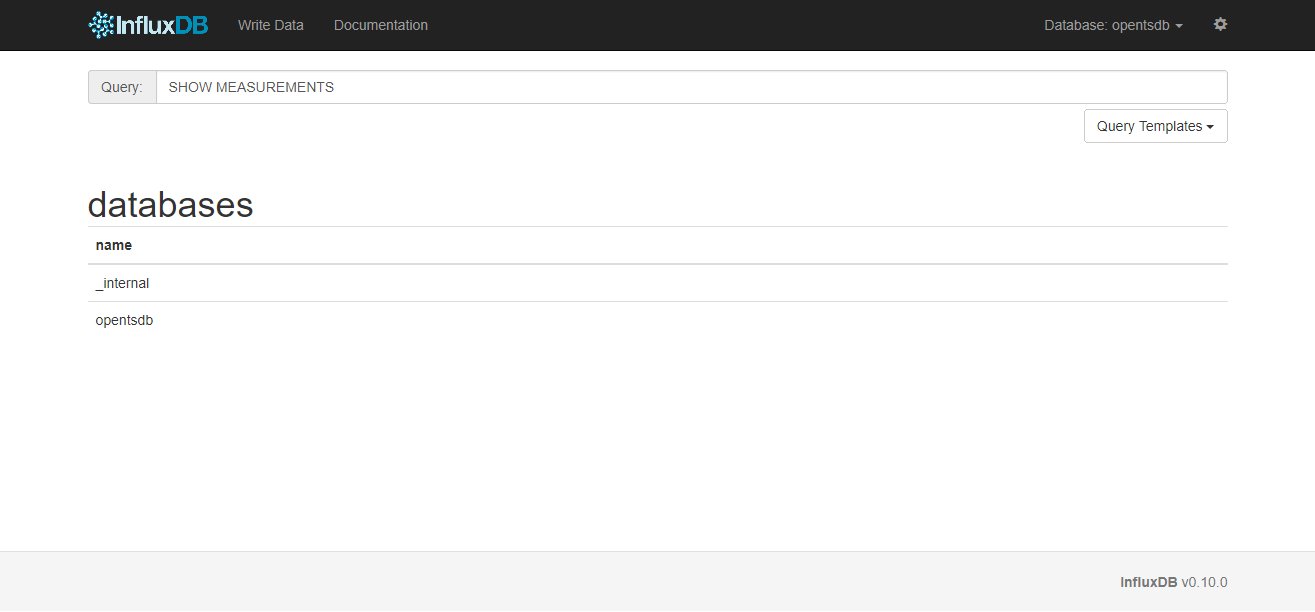
Open web broswer and typing http://172.22.4.101:8083
We can check the db name openstdb as below screenshot
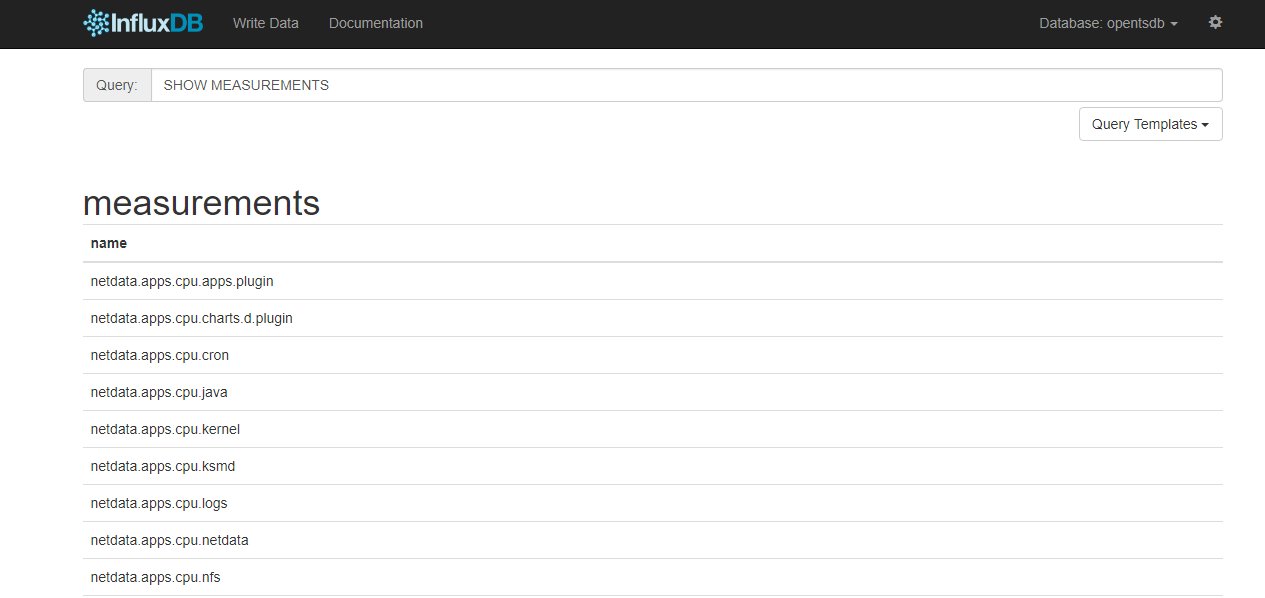
Check the netdata sending data
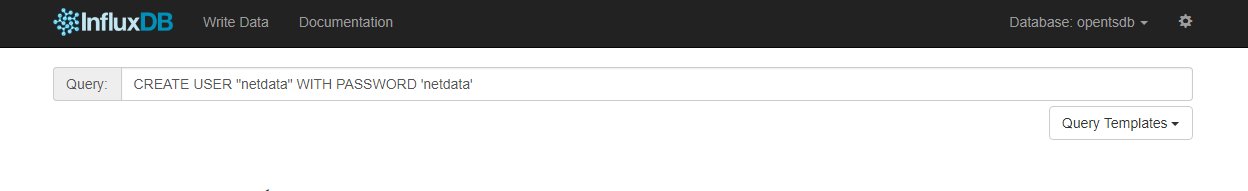
Add a user account / password for Grafana connection
Open web browser and typing http://172.22.4.101 login with default account and password: admin / admin
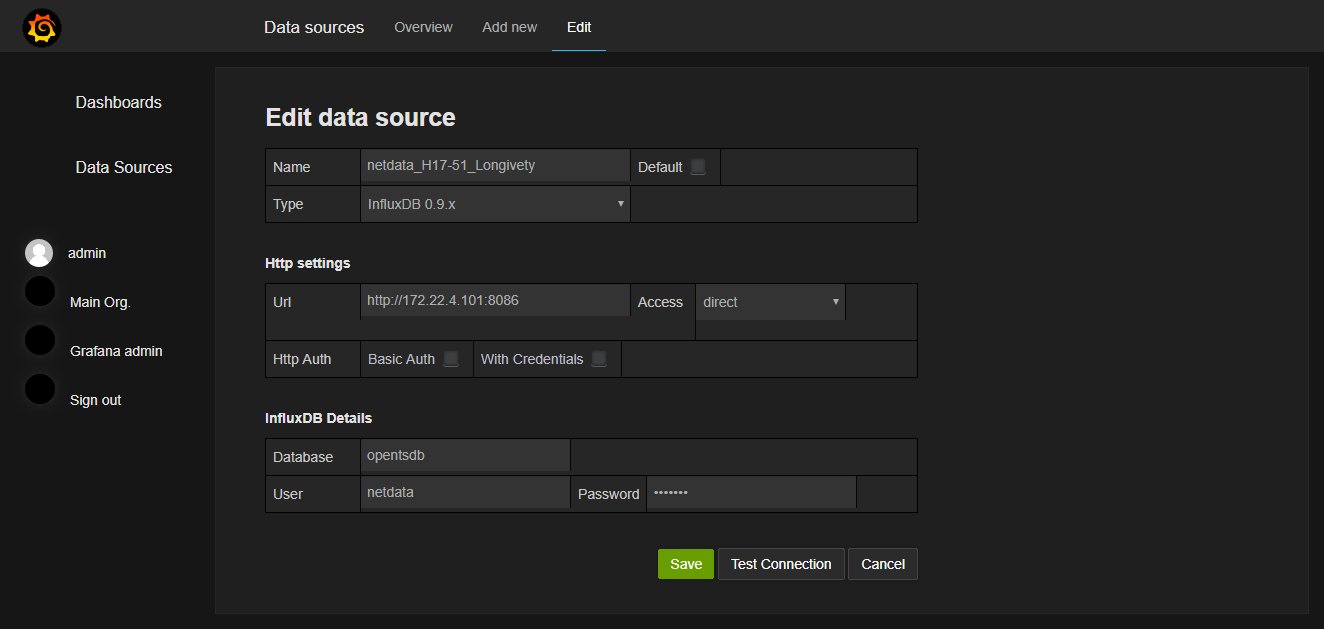
Then add Data Sources
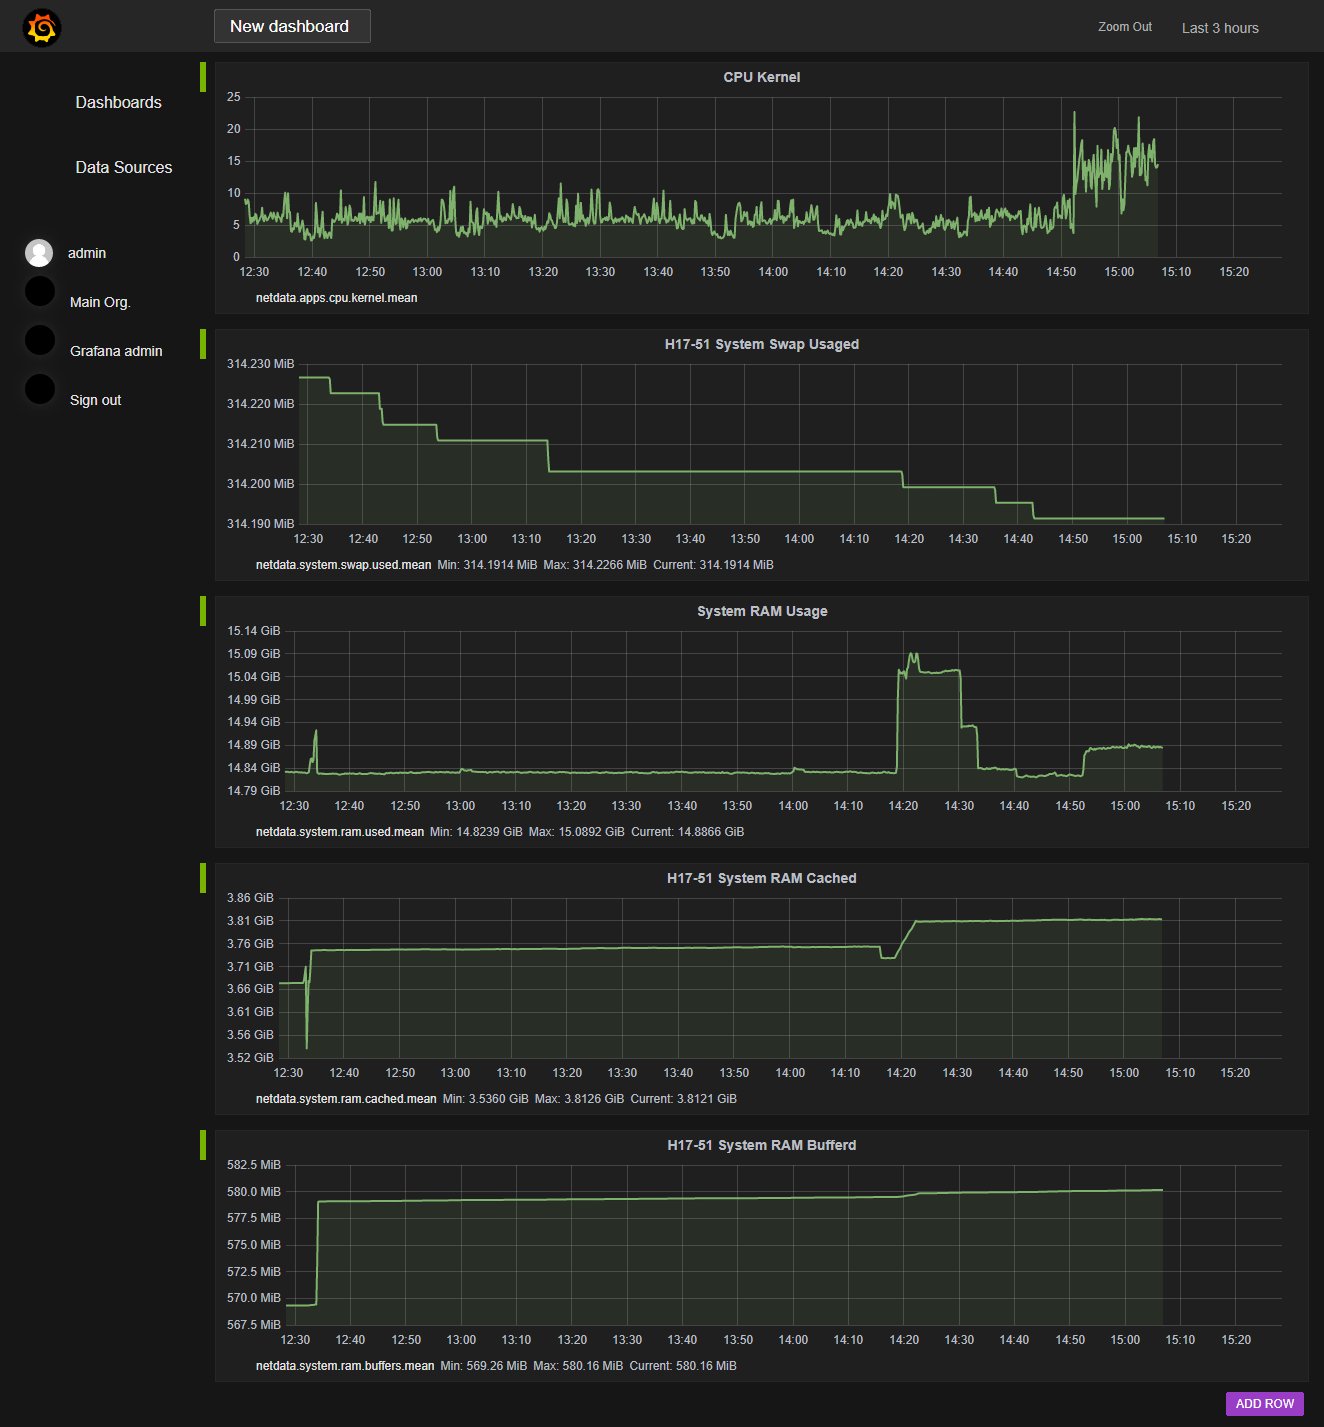
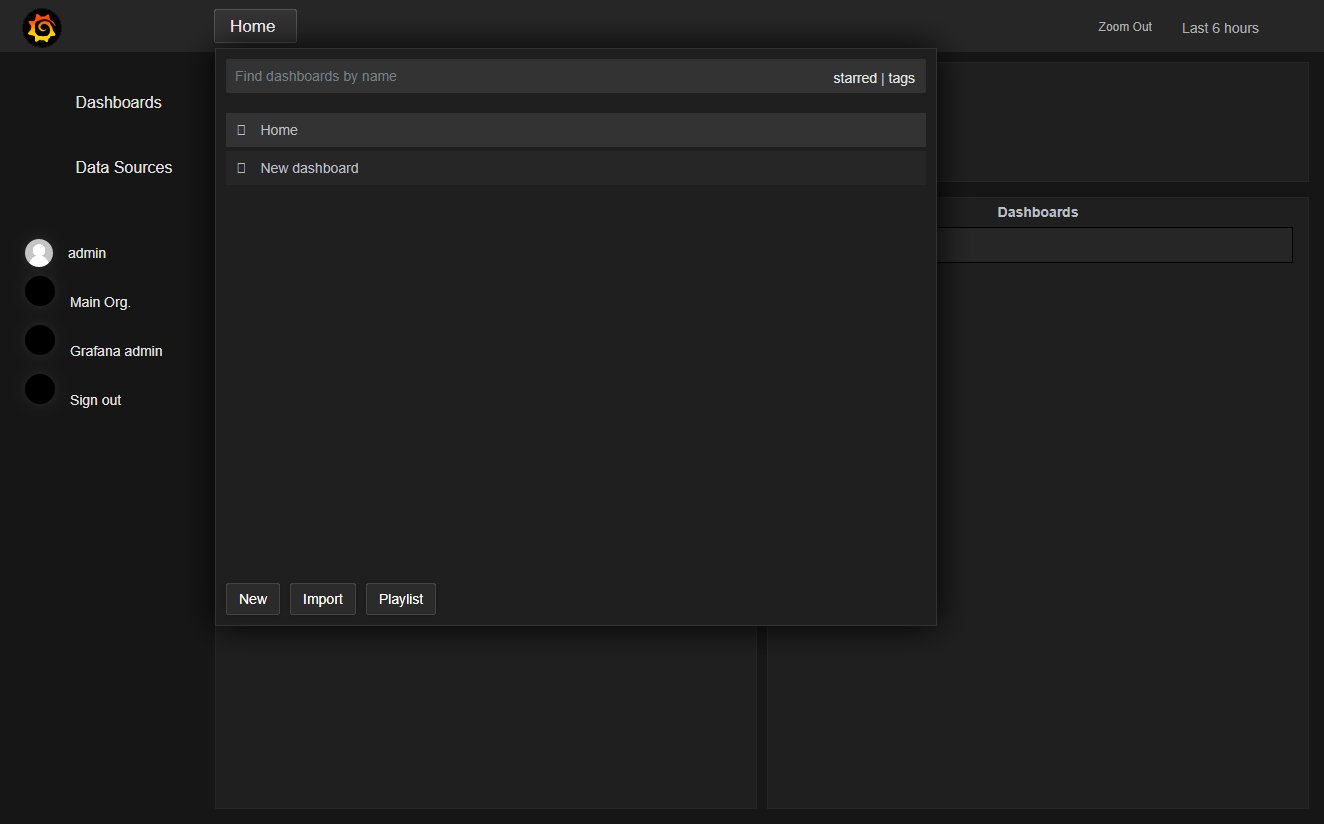
New a Dashboards
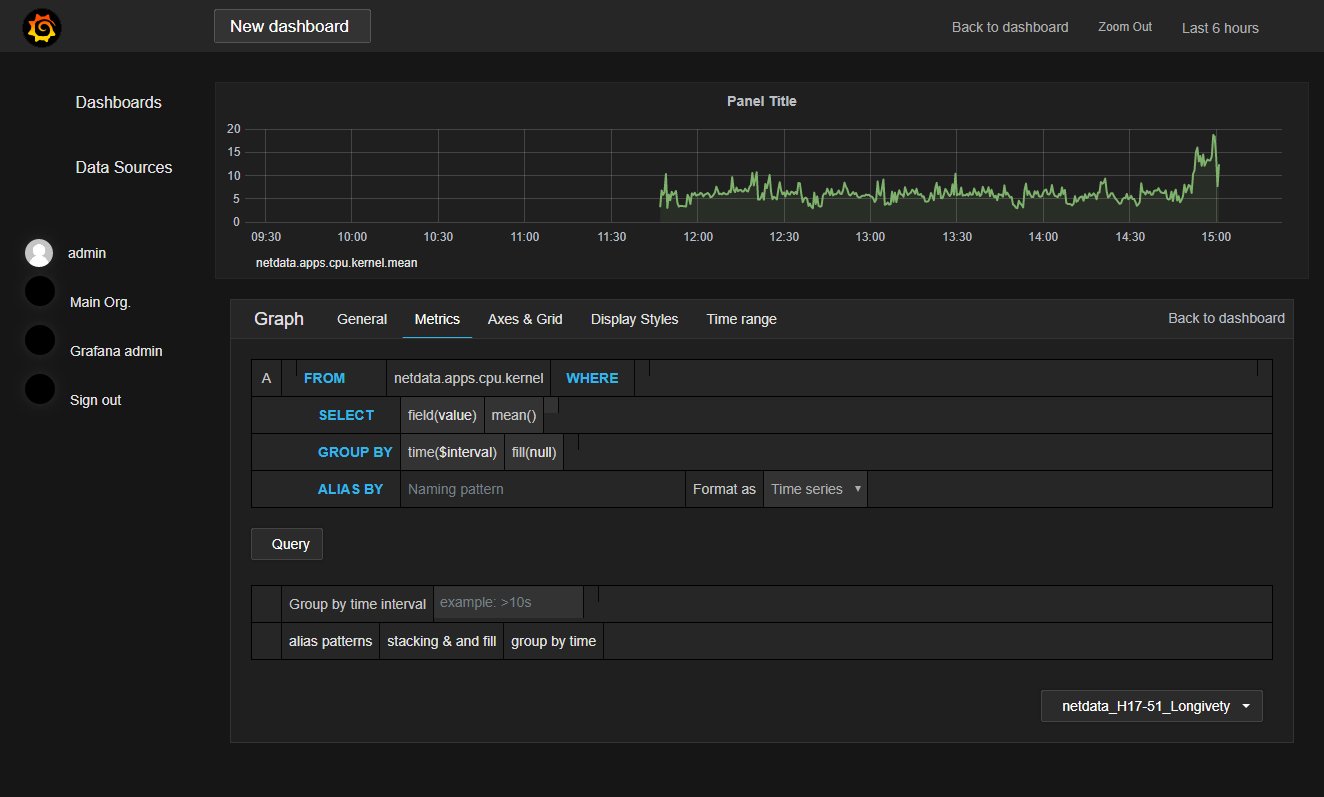
Edit Metrics and select data source FROM
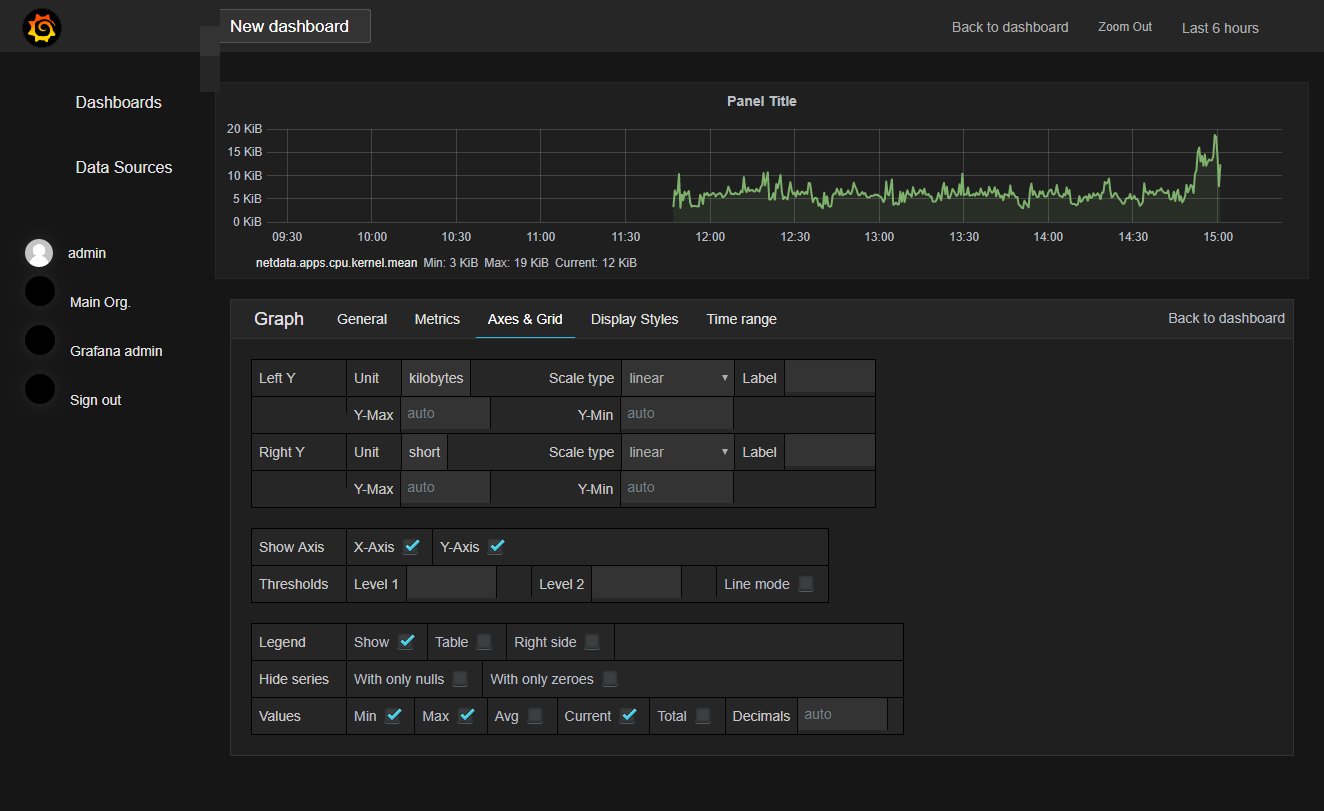
Edit Axcs & Grids Change Left Y Unit to current unit
Finally , Ctrl + s for save setting